Think your local radio station plays the same songs over and over again? Think that it's getting worse over time? Then prove it with graphs!
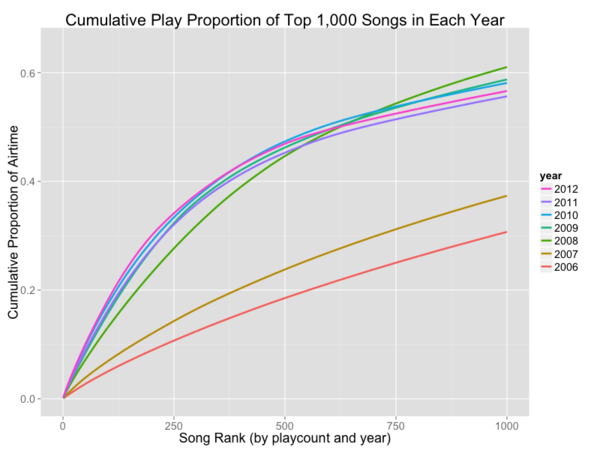
This excellent analysis of Minnesota's The Current shows what can be done with a little bit of R code and some curisoity.
oooh, good's best infographics of 2009
some excellent data visualization on the afgan war
i've linked it before, but daytum is pretty awesome
while the last line sounds anti-css (sort of?), it turns out pie charts suck
not sure why i'd never seen it before, but grabperf is pretty cool. only the html pull time, so it's not super useful for actual customer impact measurement, but still some interesting data (and nice graphs!)
james wheare found an excellent hidden resource for the uk mapping crowd - a publically accessible database of all uk bus network geo locations (bus stops, etc) called NapTAN. seems like anyone can sign up and get the data. woo