Using CloudWatch to track memory usage on Lightsail instances
By Cal Henderson, July 11th 2019.
Lightsail is the simplified version of AWS EC2, aimed at easily replacing dedicated or VPS servers. It's easy to use, but lacks the ability to track metrics beyond CPU and network usage. AWS has CloudWatch to fill that gap, but it doesn't work out of the box with Lightsail, so requires some hoop jumping to get it working. I spent a few hours figuring it out, and wanted to make it easier for anyone else in the same situation.
Step 1: Set up an IAM user
In the main AWS console, create an IAM user with permission to send metrics to Lightsail. To do this, follow the instructions to Create IAM Users to Use with the CloudWatch Agent on On-Premises Servers. Your name of your user doesn't matter, but note down the access key and secret.
Step 2: Install the CloudWatch Agent
I'm using Ubuntu, so it was as simple as:
wget https://s3.amazonaws.com/amazoncloudwatch-agent/ubuntu/amd64/latest/amazon-cloudwatch-agent.deb
sudo dpkg -i -E ./amazon-cloudwatch-agent.deb
You can find instructions for other platforms here.
Step 3: Set up credentials
If you've used AWS command line tools before, you'll be familiar with the AWS config file. You will need to add a new profile to your AWS config for CloudWatch to use. In my setup, I'm running the agent as root. If you want to run it as a different user, there is some complexity.
One important difference to most AWS command line tools is that the API key and secret must be stored in the credentials file - the config file will not work. I my case, I added this section to my /root/.aws/config file:
[profile AmazonCloudWatchAgent]
region = us-west-2
And this section to my /root/.aws/credentials file:
[AmazonCloudWatchAgent]
aws_access_key_id=AKIA........
aws_secret_access_key=........
Note that the credentials file does not have the word "profile" in the section header.
Step 4: Generating your configuration file
Run the wizard to generate the config for the metrics you want to collect:
/opt/aws/amazon-agent/bin/amazon-cloudwatch-agent-config-wizard
This will create a file called /opt/aws/amazon-cloudwatch-agent/bin/config.json which you can further edit by hand if needed. You probably want to save this in source control - the actual location of the file does not matter, so long as you use the correct path in step 6.
Step 5: Fix the broken default config
Even though the agent has a command line argument to say ignore assumed EC2 roles and treat the machine as an on-premise server, the agent ignore this setting and uses the Lightsail assumed IAM role, which doesn't allow posting CloudWatch metrics and can't be edited. To fix this, we need to add the following lines to /opt/aws/amazon-cloudwatch-agent/etc/common-config.toml:
[credentials]
shared_credential_profile = "AmazonCloudWatchAgent"
This needs to match the name of the config profile you created in step 3.
Step 6: Start the agent
Start the agent up like this:
/opt/aws/amazon-cloudwatch-agent/bin/amazon-cloudwatch-agent-ctl -a fetch-config -m onPremise \
	-c file:/opt/aws/amazon-cloudwatch-agent/bin/config.json -s
Make sure to use the correct path to your config file. You should see some success messages. You can also check the log file at /opt/aws/amazon-cloudwatch-agent/logs/amazon-cloudwatch-agent.log to check for authentication/credential errors.
The agent will automatically restart when the box is rebooted
Step 7: Success
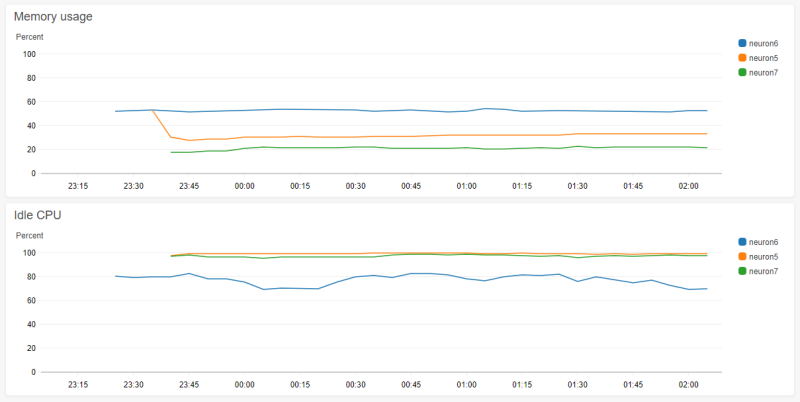
After a couple of minutes, open the CloudWatch dashboard in the AWS console, switch to the correct region, and look at the Metrics section. You should see a section called "CWAgent" under "Custom Namespaces", unless you changed the namespace in your config file. You have some metrics!
Credit to David J Eddy for a blog post that got as far as I initially did, but had a comment from Alberto Zirondelli which figured out the credentials config bug.