Sources of U.S. Tax Collection
By Cal Henderson, October 28th 2010.
If you want to know how U.S. taxes are spent, there are plenty of good sources of information. The 6 sq ft Death & Taxes poster from WallStats gives an excellent overview of relative budgets. But where does the tax money come from to begin with? This is the question I set out to answer.
The information can be found in the U.S. Census Bureau, which like many government departments has a ton of data that's hard to find and understand. The Quarterly Summary of State & Local Tax Revenue is what we care about. The PDFs contain some big impenetrable data tables, so I turned them into simple charts.
So where does the money come from?
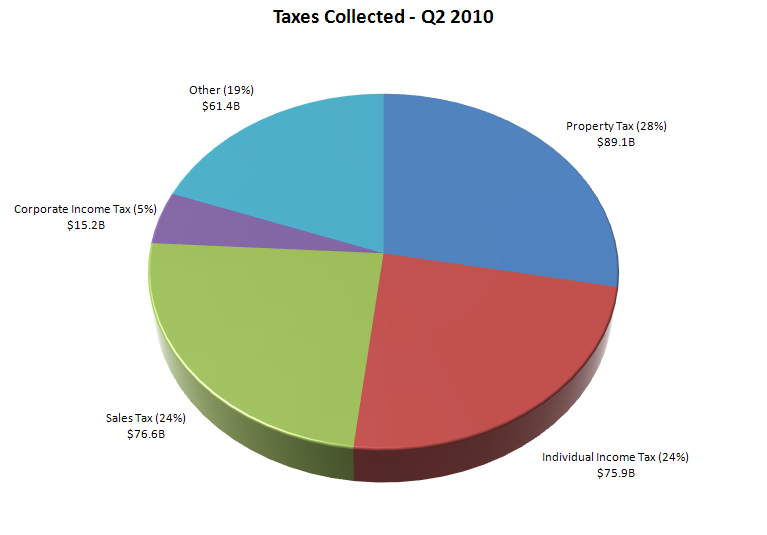
The 'other' slice represents 19% of total taxes collected, and can be broken down a little further.
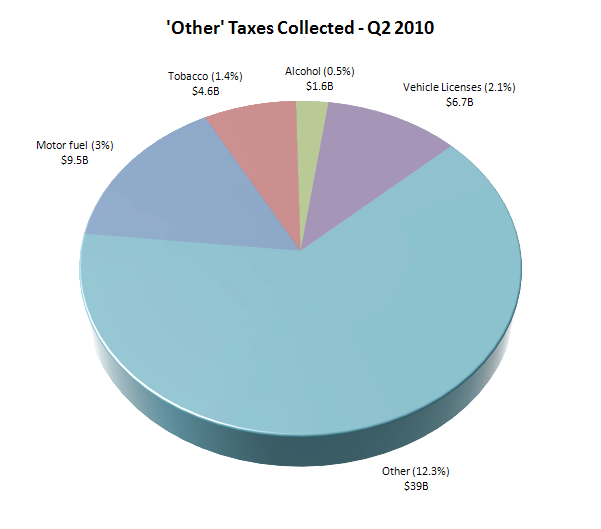
The source of the 'other' slice here, 12.3% of the total, isn't specified in the census data. It contains Severance taxes ($3.4B) and Documentary and stock transfer taxes ($1.2B), but there are another $34.4B unaccounted for. If you know where it comes from, let me know!
The data for the charts above is as follows, along with the same data from 10 and 20 years ago.
| Q2 2010 | Q2 2000 | Q2 1990 | |
|---|---|---|---|
| Property Tax | $89.1B | $47.8B | $34.5B |
| Sales Tax | $76.6B | $58.0B | $30.3B |
| Individual Income Tax | $75.9B | $69.4B | $24.4B |
| Corporate Income Tax | $15.2B | $13.4B | $5.0B |
| Motor Fuel | $9.5B | $7.8B | $5.2B |
| Vehicle Licenses | $6.7B | $5.0B | $2.6B |
| Tobacco | $4.6B | $2.1B | $1.5B |
| Alcohol | $1.6B | $1.2B | $0.9B |
| Other | $39.0B | $25.7B | $21.1B |
| Total | $318.2B | $230.4B | $116.5B |
While the amounts have clearly changed over time (an increase of 173% in 20 years), the proportions have stayed pretty much the same.
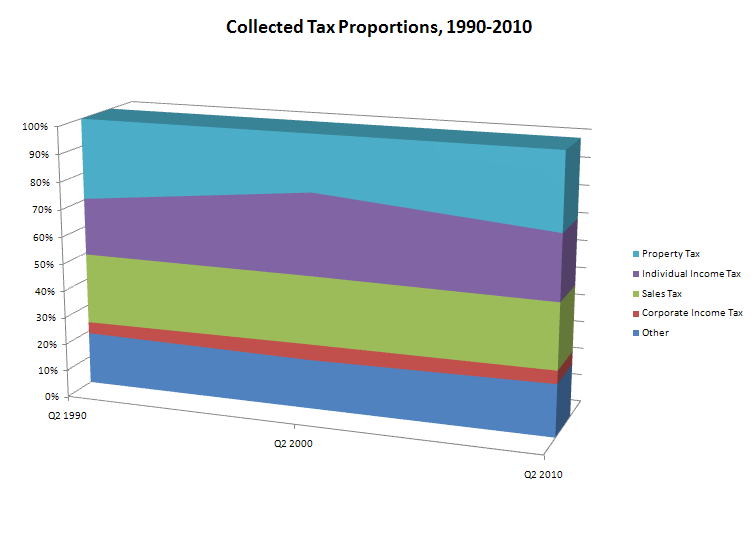
Around 75% of all collected taxes come from property tax, individual income tax and sales tax. Property tax is currently the highest, representing almost a third of all collected taxes. Motor fuel contributes almost as much tax as corporations, while tobacco products make three times the money of alcohol.
Post-Script
This is not an analysis of the data - just a quick and simple visualization to understand where U.S tax money comes from. If you spot any glaring mistakes or omissions, drop me an email and teach me: cal [at] iamcal.com
Copyright © 2010 Cal Henderson.
The text of this article is all rights reserved. No part of these publications shall be reproduced, stored in a retrieval system, or transmitted by any means - electronic, mechanical, photocopying, recording or otherwise - without written permission from the publisher, except for the inclusion of brief quotations in a review or academic work.
One person has commented
Leave your own comment
Comments have been disabled
# October 29, 2010 - 2:15 am PST
<a href="http://public.tableausoftware.com/views/SourcesofUSTaxCollection/Dashboard">public.tableausoftware.com/views/SourcesofUSTaxCollection/Dashboard</a>
You can un-check the taxes if you want to zoom into the smaller amounts.
I am not a fan of pie and stacked area charts, I feel they are a poor medium for communicating qualitative amounts as they can be visually misleading, especially in 3D perspective.